
- high-resolution terminology - matching measurements at high-resolution
Talk:Hydrogenion flux
Description
Volume-specific proton flux is measured in a closed system as the time derivative of proton concentration, expressed in units [pmol·s-1·mL-1]. Proton flux can be measured in an open system at steady state, when any acidification of the medium is compensated by external supply of an equivalent amount of base. The extracellular acidification rate (ECAR) is the change of pH in the incubation medium over time, which is zero at steady state. Volume-specific proton flux is comparable to volume-specific oxygen flux [pmol·s-1·mL-1], which is the (negative) time derivative of oxygen concentration measured in a closed system, corrected for instrumental and chemical background.
pH is the negative logarithm of proton activity. Therefore, ECAR is of interest in relation to acidification issues in the incubation buffer or culture medium. The physiologically relevant metabolic proton flux, however, must not be confused with ECAR.
Abbreviation: JH+
Reference: Gnaiger 2014 MitoPathways
Proton flux versus glycolytic flux
- Measured changes in pH over time (ECAR) must be transformed from the logarithmic scale to the linear scale of proton flux.
- Measurement of extracellular proton production and glycolytic flux are related under specifically controlled conditions. Such conditions must be carefully evaluated, may require modifications of protocols, and must be corrected for acid-base reactions unrelated to glycolytic flux.
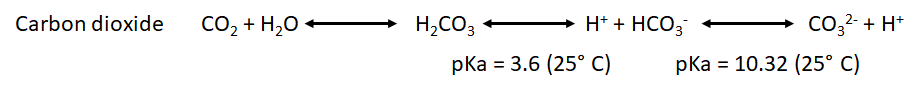
- The measurement of proton flux alone is not sufficient to determine if the origin of the protons is the glycolysis or other sources. For example, the carbon dioxide formed during the mitochondrial respiration acts as a net donor of protons into the media and as consequence has to be taken into account. During the oxidation of the glucose, we have two main metabolic pathways involved and both have a net effect over the proton flux:


- As we can observe, the production of protons by the oxidative phosphorylation is three times higher than the one produced by the glycolysis per molecule of glucose. However, the chemical rate of production could be determinant to determine which is the main source of protons in our sample under specific conditions.


- We have also to take into account the pka for the point of equilibrium of the most common weak acids that will be formed during both processes:
Additional resources
» O2k-Manual: MiPNet23.15 O2k-pH ISE-Module
» O2k-SOP: MiPNet08.16 pH calibration
» MitoPedia O2k and high-resolution respirometry: O2k hardware

MitoPedia O2k and high-resolution respirometry:
O2k-Open Support
O2k signal and output
- O2k signal: The O2k-pH ISE-Module is operated through the pX channel of the O2k, with electric potential (volt [V]) as the primary and raw signal
- O2k output: type I and II
pH changes versus glycolytic flux
- Measurement of extracellular proton production and glycolytic flux are related under specifically conrolled conditions. Such conditions must be carefully evaluated, may require modifications of protocols, and need data analysis beyond reporting changes of pH.
- The extracellular acidification rate (ECAR) is the change of pH over time, which may be of interest in relation to acidification problems in a culture medium or incubation buffer. pH is the negative logarithm of proton activity. Comparable to volume-specific [[oxygen flux] [pmol·s-1·mL-1]], which is the (negative) time derivative of oxygen concentration measured in a closed system, volume-specific proton flux is the time derivative of proton concentration, expressed in units [pmol·s-1·mL-1]]. The physiologically relevant metabolic proton flux, therefore, must not be confused with ECAR.
- » Proton flux
- Very small buffering capacity is required: To accurately measure biologically induced changes in pH, the buffering capacity of the medium has to be small. This may be addressed either by using or preparing media with a buffering capacity that is low but still sufficient to keep the pH in the desired range for a limited period of time. An alternative approach is to use buffers with very low buffering capacity and keep the pH value inside the desired limits by a pH-Stat.
Compare measurement of pH with the pH electrode and ratiometric fluorometric methods (NextGen-O2k)
- » Carboxy SNARF 1
- » HPTS
O2k-Manual
Introduction and scope
- The Oroboros O2k supports the modular O2k-MultiSensor extension for recording potentiometric (voltage) signals simultaneously with the oxygen signals in both O2k-chambers. A new pH probe system is described here, consisting of separate reference and measuring electrodes.
- Definition of terms
- pH/ISE: The potentiometric channels may be used with different kinds of pH / ISE (ion selective electrode) modules, (i) with the pH / reference electrode module described here, or (ii) with an ISCE – an ion selective combination electrode, combining reference and measuring electrode into one sensor (pH combination electrodes, other ion selective electrodes; see O2k-TPP+_ISE-Module). The O2k not only includes the two potentiometric channels, but supports two additional amperometric (current) channels for the O2k-Fluo_LED2-Module or amperometric sensors (NO, H2O2, etc).
- pX: Potentiometric measurements result in a voltage signal which is typically a linear function of the logarithm of the activity (concentration) of the substance of interest (the analyte). A calibrated pH electrode displays the negative decadic logarithm of the H+ ion activity (potentia hydrogenii) and thus got its name “pH electrode”. By analogy, an ISE may be used to measure pTPP, pCa, etc., hence the general term “pX” is used to denote the signal from such an ISE.
- Conditioning: Optimum response time will be obtained after the probe has been exposed to two buffer solutions. Place a pH 4 buffer or equivalent in a beaker and a pH7 buffer or equivalent in a second beaker. Hold the pH electrode and reference electrode together and touch the pH 4 buffer surface, allowing 15-20 seconds of equilibration. Rinse the two electrodes with distilled water and then touch the pH 7 buffer surface in the same manner. Repeat several times.
- Handling: Be careful not to apply pressure against, or to shock, the inner glass capillary tube.
- Cleaning: When using the electrode in solutions containing protein, the pH electrode and reference electrode should be soaked in enzyme cleaning solution such as Terg-a-zyme (Alconox Inc), or a chromic/sulfuric acid glass cleaning solution after each use for a few minutes to remove the protein from the glass and the reference junction. This will prolong the lifetime of the electrode.
- Storage: Always clean the electrode before storing.
- Long-term storage (over 2 weeks): Place the electrode into its original container in the same condition in which your received it. Usually this means moistening with distilled water the sponge located in the bottom of the protective glass tube.
- Short-term storage: The electrode can be left in acidic pH buffer solution, e.g. pH 4.
- Troubleshooting: If possible try to locate the problem either at the measuring pH or at the reference electrode by switching electrodes. If you have only one reference electrode you can switch to a spare glass barrel for diagnostic purposes. The following text assumes that the problem was located on the reference electrode.
- Little or no response: Inspect the electrode for visible cracks (usually occurring at the tip of the electrode). If any exists, the electrode is defective and must be replaced. The slightest crack in or around the tip of the electrode may cause the electrode to read about the same in all solutions.
- Response pegs off-scale: (i) Check the pX gain setting. (ii) Visually inspect the electrode for a broken bulb.
- Sluggish response: If the electrode becomes sluggish in responding to changes in pH, the response time can be improved using the following procedure:
- Clean the electrode as described above.
- Soak the electrode in 0.1 N HCl for 5 minutes, followed by soaking in 0.1 N NaOH for 5 minutes. After repeating several times, rinse the electrode thoroughly with distilled water. The electrode can then be calibrated in the usual manner.
Reference electrode: assembly, storage and maintenance
- -See: MiPNet15.03 O2k-MultiSensor-ISE in section 2.5.Reference electrode: assembly, storage and maintenance
O2k-MultiSensor System
- Applications of the O2k with one or two potentiometric electrodes (ISE or pH) require an O2k Series D and higher, or a previous O2k-Series with electronic MultiSensor upgrading. In addition to the two polarographic (amperometric) oxygen channels, the O2k provides two electronic channels for potentiometric (voltage) measurements with ISE or pH (O2k Series B upwards). The Multisensor function of O2k Series D (and higher) is extended further with two additional amperometric channels (current measurement; for NO, etc.). Please see O2k-Main Unit#O2k-Series for how to determine the series of an oxygraph.
O2k-FluoRespirometer
- Connect: In O2k Series D and higher, pH and reference electrodes are directly connected to the plugs on the front side of the O2k. Insert the connector of the pH electrode into the BNC plug labelled “pX” and the connector of the reference electrode to the 2 mm pin plug labelled “Ref”. See MiPNet22.11 O2k-FluoRespirometer manual.
- Gain: The gain of the pX channel can be selected in the DatLab software in the O2k configuration window. For measurements with the OROBOROS pH system, a gain of 20 is suggested. Usually it will not be necessary to change the gain for pH work.
O2k Series B and C, pX upgrade
Operation instructions
Insertion of electrodes: bubble-free filling of the chambers
- -See: MiPNet15.03 O2k-MultiSensor-ISE in section 4.1 Insert ISE
Volume calibration with MultiSensor stoppers
- Add to the dry O2k-chamber containing the stirrer bar a water volume accounting for the final chamber volume (2 mL) plus the additional dead volume in the capillary and spaces between electrodes and inlets. For the OROBOROS pH Assembly (ion selective electrode + reference electrode), this additional volume is approximately 0.14 mL. Therefore, the necessary volume to calibrate a chamber volume of 2 mL with the Oroboros pH system is 2.14 mL.
- Start stirring, cover the chamber with a Perspex cover or a loosely placed stopper, and wait for equilibration. To avoid creating bubbles during the calibration process it is very important to allow for full thermal equilibration of the liquid in the chamber. Continue with volume calibration only after reaching the conditions for oxygen calibration at air saturation (stable temperature and Peltier power, near-zero uncorrected oxygen flux (±1 pmol∙s1∙mL1).
- Afterwards follow instructions written in MiPNet15.03 O2k-MultiSensor-ISE in section 4.1 Insert ISE
Handling during an experiment
- -See: MiPNet15.03 O2k-MultiSensor-ISE in section 4.3. Experiment
Instrumental background oxygen flux
- -See: MiPNet15.03 O2k-MultiSensor-ISE in section 4.3. Instrumental background oxygen flux
pH calibration
Performance, trouble shooting, and electrode lifetime
- Performance criteria can be assessed by two tests:
- 1. Calibrations must be reproducible: After performing a two point calibration, reinserting the electrodes in the first used calibration buffer should give the correct calibrated pH value. The slope and intercept of the calibration can be copied to a spreadsheet file (File:PH-Calibration-List.xls) to obtain a track record..
- 2.Drift: The drift in the medium without biological sample hast to be small as compared to pH changes expected from the sample. The drift will be different in different media (buffering capacity), so for each used system the necessary experience has to be gained. The drift is the first time derivative of the pH signal, so in DatLab it will be shown as “pX Slope”. After proper calibration the unit of this plot will be mpH/s.
- Trouble shooting: If the required performance criteria are not reached, the following steps should be tested:
- Set the polarisation voltage of the O2 sensor to 0 V in the O2k Control window. Observe any effects on the pX raw signal. A tiny potential jump is acceptable. If a drift in the pX signal is either increased or reduced by this test or an extreme jump in the signal observed, the membrane of the polarographic oxygen sensor (POS) should be replaced. Reset the polarisation voltage to 800 mV after the test.
- If you have two pH electrodes: Locate the problem to either the reference electrode or the pH electrode by switching either only the pH or only the reference electrode between chambers.
- Follow the specific trouble shooting procedures for the reference electrode or the pH electrode described above.
- pH electrode lifetime: All glass pH electrodes do have a limited lifetime due to aging of the glass membrane. After 1.5 to 2 years a loss of performance will occur even without use. Therefore, we strongly recommend to obtain pH electrodes only when required for a defined project and not buy the electrodes ahead of need.
Measuring proton production
From the change of the pH signal
- To calculate the actual proton flow in the system from the observed change in the pH signal the buffering capacity of the medium has to be determination of before the introduction of sample. This is best achieved by setting up the TIP with HCl in the syringes and simulate the expected proton production of the sample by setting an appropriate flow rate for the TIP. In the simplest implementation just one flow rate is used for about 5 minutes. From the first time derivative of the pH signal the buffering capacity can be calculated. Afterwards the TIP has to be re-fitted with syringes containing KOH (NaOH) for using the pH-Stat during the actual biological experiment. The observed rates of pH changes during the biological experiment (pX slope/ first time derivative of pH signal) can then be directly converted to Proton flow values using the buffering capacity determined before. This is shown in the spreadsheet file "pH Stat Template Buffer Capacity_one_point" In a more sophisticated approach a multiple point calibration is done: Several proton flows are simulated before the experiment, a linear regression between set proton flow and observed pH slope is done and the regression parameters are used to calculate proton flows from the pX slopes observed during the biological experiment.
- These approaches assume a linear relationship between pH change and introduced protons. This is an approximation that is only valid for very small pH changes. In other words the buffering capacity has to be constant during the entire experiment.
- For calculating proton production rates following this approach directly in DatLab, see below.
From the amount of injected base
- The limitations mentioned above can be overcome by using the amount of base necessary in the pH-Stat approach to hold the pH value constant. If the pH values at the beginning and at the end of a time interval are identical then the proton floe during this time interval can be directly calculated from the amount of base injected to keep the pH value constant. While this method does not assume a constant buffering capacity during the entire experiment there are some drawbacks:
- Usually only the "pH-Stat-strict" approach will assure the identical pH values at the beginning and the end of a time period necessary for this approach (This could possibly be overcome by more advanced data analysis).
- Only one value for proton flow for each period between injections is calculated in contrast to the continuous recording facilitated by the first mentioned method.
- The injected volumes have to be read out form TIP events. This can be partially automated in a spreadsheet template (pH Stat Template Injected Volume) but is more tedious than the method using the buffering capacity
- Initial trials with simulated proton flows indicted this method to be slightly less precise than the method using the buffering capacity.
Conclusion and templates
- A potential compromise would be to use the method based on buffering capacity for routine calculations but check selected (late) phases of the experiment with the method based on added base volume. Thereby, significant changes in buffering capacity during the experiment should be detected. Spreadsheet (Excel) templates for both methods are available for download here.
DatLab analysis
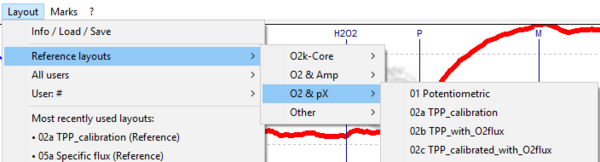 pX reference layouts

- Graph layout: Four reference layouts are available in DatLab 7 based on the recorded pX signal:
- 01 Potentiometric
- 02a TPP_calibration
- 02b TPP_with_O2flux
- 02c TPP_calibrated_with_O2flux
- These layouts can be selected in [Layout / Reference layouts / O2 & pX].
- Graph layout: Four reference layouts are available in DatLab 7 based on the recorded pX signal:
- Reference layouts can be modified and saved as user-defined layouts, see MitoPedia: DatLab.

pX settings
- In the O2k configuration window the pX channel can be activated and a label for the inserted pX electrode can be entered for documentation purposes.
- Gain and Offset voltage [mV] for the pX channel can be set in the O2k control window [F7], tab: Potentiometric, pX. The gain influences the "pX Raw Signal” recorded in DatLab. Therefore, a gain of 1 will give the same voltage [V] as would be measured with any multimeter between reference and measuring electrode.
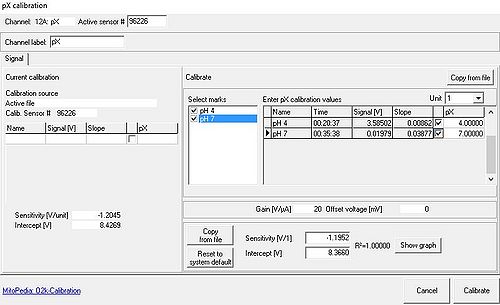
pX calibration
- From the Calibration menu the pX Calibration window window [Potentiometric, pX] is opened. This feature allows for a simple two-point linear calibration of pX (or –pX) as a function of recorded voltage, using data ranges marked for calibration [Select marks] or known pX values, see O2k-calibration and pH calibration.
- Calibrations for different signal types: There is only one set of calibration values for each pX channel, irrespective of the connected electrode. If a pX channel was calibrated for a pH electrode, these values will initially also be used to calculate the calibrated signal when the pH electrode is exchanged for a TPP+ electrode. Even when observing only the raw (not the calibrated) signal, the time derivative (Slope pX) will be calculated from the calibrated signal, which might lead to confusion when the time derivative is used to access stability or signal drift. It is, therefore, suggested to set the calibrated signal to the raw signal whenever the raw signal is to be used as the primary data source.
- Calibration values from other files can be imported with Copy from file in the pX calibration window.

Calculate proton production in DatLab
- Note: Requires DatLab 5 or DatLab 6
- Proton production rates can be calculated in real-time during data acquisition. Select the menu [Flux/Slope]/[Proton Flux].
- Determining the buffering capacity of the medium:
- Calibrate the pH electrode, observe the calibrated pH signal.
- Fill TIP syringes with diluted acid or base.
- Start a slow injection of acid or base into the media (no sample present).
- Place a mark on a stable region of the slope plot of the calibrated pH signal 'pX slope".
- Go to [Plots]/[Proton Flux].
- The buffering capacity is calculated by DatLab and can be used for calculations of biological proton flow in the same file or noted down and used in subsequent experiments.
- Biological proton flux:
- Calibrate the pH electrodes.
- Observe the pH calibrated signal.
- Place marks on regions of interest on the pX slope plot. If you use the "pH" stat" se above to keep the pH value in desired limit make sure that you exclude times during which base was injected.
- Select [Flux/Slope] / [Proton Flux].
- Enter the buffering capacity in the appropriate field or use the feature in the upper part of the window to calculate the buffering capacity from a calibration experiment in the same file.
- Press [OK].
- A new plot "Proton Flux" is now available in [Graph]/[Select Plots] (right at the end of the list. You can now chose to display this plot e.g. instead of the pX slope plot by selecting its check box and de-selecting the check box of the "pX slope" plot.
- Determining the buffering capacity of the medium:
- Proton production rates can be calculated in real-time during data acquisition. Select the menu [Flux/Slope]/[Proton Flux].
- Known issues: DatLab always calculates a new buffering capacity from the input in the upper part of the window and does not remember the value from previous files. Therefore, if the determination of buffering capacity was done in a different Datlab file the value has to manually entered.
Specifications
- Specifications provided by OROBOROS INSTRUMENTS for quality control of pH electrodes:
- Drift (after 45 min stabilization, integrated over 5 minutes, 37 °C, 2 mM buffering capacity): <= 20 µpH/s.
- Specifications provided by OROBOROS INSTRUMENTS for quality control of pH electrodes:
pH-Stat
- One approach we have developed is to use the TIP to run in a "pH stat" mode, i.e. keeping the pH constant by a feedback controlled automatic injection of base. Besides keeping the pH in the desired range this can actually be used to determine proton flow from the amount of base injected, circumventing the determination of buffering capacity, see below. The "pH-Stat" allows using very weakly buffered media (2 mM buffering substances) and might even make buffering obsolete. The feedback modus of the TIP can be used in two ways to achieve a pH-Stat modus:
- pH-Stat_strict: This program keeps the pH value strictly between user defined upper and lower limits. The difference between the upper and lower limit will determine the time between injections depending on the current proton flow. Therefore, the time between injections may vary drastically with changing proton fluxes.
- pH-Stat_interval: This program adjusts the pH value in certain time intervals back to the upper limit. The difference between the upper and lower limit is set extremely small but a defined minimum pause between injections of e.g. 180 s is defined. Therefore, usually a base injection will be done every 3 minutes and the pH value will oscillate between the upper limit and some (proton flux dependent) lower limit. The lower limit set in the program has no significance because the minimum pause time will not have elapsed when the lower limit is met.
- While the pH-Stat_strict is necessary to keep the pH value in a precisely defined range the pH-Stat_interval program ensures defined periods undisturbed by any injection of base. Such periods are necessary for the calculation of proton flow from the observed pH change and theoretically also for measuring respiration (however, if a 100 mM KOH the disturbance of the oxygen signal by the small amounts of KOH added was usually very small).
- TIP2k setups in the DatLab template file DLTemplates_pH.dlt and Spreadsheet (e.g. Excel) templates for determining proton form base injections are available for download: File:DLTemplates.dlt. Please note that of course the more straightforward calculation of proton flows from the measured pH slope is also possible while operating in pH-Stat mode!
Applications
- For simultaneous measurement of O2 and pH, we refer to the classical literature on bioenergetics and the discovery of the chemiosmotic coupling mechanism, the quantification of H+/O2 stoichiometric ratios for proton pumping (Peter Mitchell). Other groups (e.g. SE_Lund_Elmer E) have used the pH electrode in the O2k in conjunction with a study of mitochondrial permeability transition.
- The majority of novel applications will address the problem of aerobic glycolysis in intact cells, using the measurement of proton production as an indirect but continuous record of lactate production and corresponding acidification of the medium, while simultaneously monitoring oxygen concentration and oxygen consumption. In a well buffered culture medium, the pH change is extremely small relative to the amount of protons (lactic acid) produced, hence a low-buffering capacity medium needs to be applied. A titration of acid (lactic acid or HCl) into the low-buffering capacity medium yields the pH-dependent buffering capacity (Delta H+ added/Delta H+ measured by the pH electrode). Under various metabolic conditions, lactic acid production is the dominant mechanism causing acidification, hence the pH measurement is a good indirect indicator of aerobic glycolysis.
Protocols
The SUIT-003 O2 ce D067 is designed to study the effect of glucose (or fructose; Crabtree effect) on ROUTINE respiration and glycolysis inhibition on LEAK-respiration simultaneously measured with proton flux in living cells. If the aim is to analyze only the Crabtree effect and the effect of 2-Deoxyglucose on proton flux and respiration via glycolysis inhibition, Oligomycin can be omitted. If there is an interest in studying coupling control, oligomycin should be added to promote LEAK-respiration. To obtain more information about the Crabtree effect, it is ideal to use in parallel the protocol SUIT-003 O2 ce D038 (glucose addition in ET state) and SUIT-003 O2 ce D037 (glucose addition in ROUTINE). The latter can be extended by the cell viability test and the Complex IV module.
Demo Experiment with simulated proton flow

- Medium: imidazole buffered medium, see above
- Calibration steps (for calculating buffering capacity): 30, 90, 150 HCl pmol/(s mL): TIP 1 mmol/L HCl, pump speed 0.06, 0.18, 0.3 µL/s
- Simulated proton flow 30,90,150 pmol HCl/(s mL) in pH stat mode: The pH value was held inside narrow limits by using the TIP in pH stat mode (100 mM KOH, Tip set up similar to the one included in DLTemplates_pH.dlt available from http://www.oroboros.at/index.php?id=ph-oxygen. The proton flow was simulated using a second TIP
- Bioblast links: pH and protons - >>>>>>> - Click on [Expand] or [Collapse] - >>>>>>>
- pH and protons
- » pH
- » hydrogen ion H+
- » hydron H+
- » hydronium ion H3O+
- » hydride H-
- » proton p+
- » pH buffering capacity
- » proton flux
- » proton pump versus hydrogen ion pump
- » proton leak
- » proton slip
- » protonmotive force
- pH and protons
- O2k-pH
- » O2k-Catalogue: O2k-pH ISE-Module
- » O2k-Manual pH electrode: MiPNet23.15 O2k-pH ISE-Module
- » O2k-SOP: MiPNet08.16 pH calibration
- » File:PH-Calibration-List.xls
- » NextGen-O2k, ratiometric: Carboxy SNARF 1
- » NextGen-O2k, ratiometric: HPTS
- » pH calibration buffers
- O2k-pH
- O2k-Publications
- HRFR - general
- » O2k-Manual: MiPNet22.11 O2k-FluoRespirometer manual
- » O2k signals and output
- » O2k-SOP: MiPNet14.06 Instrumental O2 background
- » MiPNet19.18A O2k-Series G: Start
- » ESD
- » O2k configuration
- » O2k control
- » O2k-FluoRespirometer
- » O2k-Main Unit#O2k-Series
- » Titration-Injection microPump
- » Compare: O2k-TPP+_ISE-Module
- HRFR - general
- DatLab
References
- O2k-Manual: Contents: O2k-Core Manual.pdf
| Chapter | Section | Last update |
|---|---|---|
| MiPNet07.08 User information |  | 2017-11-03 |
| MiPNet19.18 O2k-Series G Core manual | | 2016-08-08 |
| MiPNet19.18B POS-service | | 2021-06-23 |
| MiPNet19.18C DatLab 6: Guide | | 2016-08-24 |
| MiPNet19.18E O2 flux analysis - DatLab 6 | | 2016-08-08 |
| MiPNet26.06 DatLab 7: Guide | | 2021-06-02 |
| MiPNet28.10 SmartPOS-service | | 2023-09-29 |
- TIP2k-Manual***
- » O2k-Catalogue: TIP2k
- » O2k-Publications: TIP2k
| Chapter | Section | Last update |
|---|---|---|
| MiPNet12.10 TIP2k-manual | | 2021-07-08 |
- Bioblast links: pH and protons - >>>>>>> - Click on [Expand] or [Collapse] - >>>>>>>
- pH and protons
- » pH
- » hydrogen ion H+
- » hydron H+
- » hydronium ion H3O+
- » hydride H-
- » proton p+
- » pH buffering capacity
- » proton flux
- » proton pump versus hydrogen ion pump
- » proton leak
- » proton slip
- » protonmotive force
- pH and protons
- O2k-pH
- » O2k-Catalogue: O2k-pH ISE-Module
- » O2k-Manual pH electrode: MiPNet23.15 O2k-pH ISE-Module
- » O2k-SOP: MiPNet08.16 pH calibration
- » File:PH-Calibration-List.xls
- » NextGen-O2k, ratiometric: Carboxy SNARF 1
- » NextGen-O2k, ratiometric: HPTS
- » pH calibration buffers
- O2k-pH
- O2k-Publications
- HRFR - general
- » O2k-Manual: MiPNet22.11 O2k-FluoRespirometer manual
- » O2k signals and output
- » O2k-SOP: MiPNet14.06 Instrumental O2 background
- » MiPNet19.18A O2k-Series G: Start
- » ESD
- » O2k configuration
- » O2k control
- » O2k-FluoRespirometer
- » O2k-Main Unit#O2k-Series
- » Titration-Injection microPump
- » Compare: O2k-TPP+_ISE-Module
- HRFR - general
- DatLab
MitoPedia concepts:
MiP concept
MitoPedia methods:
Respirometry,
Fluorimetry