Difference between revisions of "Talk:DatLab"
| Line 12: | Line 12: | ||
== DatLab installation support == | == DatLab installation support == | ||
{{Technical support integrated}} | {{Technical support integrated}} | ||
'''Question:''' [[DatLab]] was installed successfully but when trying to run it I get errors complaining about access to some strange looking files. | '''Question:''' [[DatLab]] was installed successfully but when trying to run it I get errors complaining about access to some strange looking files. | ||
| Line 30: | Line 29: | ||
=== DatLab 5.2 === | === DatLab 5.2 === | ||
* Menu [O2k-Multisensor]/[Calibration] The Amp channel can now be calibrated using a multiple point linear regression: | * Menu [O2k-Multisensor]/[Calibration] The Amp channel can now be calibrated using a multiple point linear regression: | ||
# Select the Amp plot to be calibrated as active plot. | # Select the Amp plot to be calibrated as active plot. | ||
| Line 113: | Line 112: | ||
Hi Mario, | Hi Mario, | ||
By the way, to open DatLab file in Mac system, I install a program called "VitualBox" which is free for basic version. With that, I can install windows in my Mac and therefore all other programs that can be installed in PC. I can open DatLab file without any problem. I am not sure if I can run DatLab to collect data in real-time. Never try it yet since I use other PC to run experiment. | By the way, to open DatLab file in Mac system, I install a program called "VitualBox" which is free for basic version. With that, I can install windows in my Mac and therefore all other programs that can be installed in PC. I can open DatLab file without any problem. I am not sure if I can run DatLab to collect data in real-time. Never try it yet since I use other PC to run experiment. | ||
:~ [[user:Peter Lin]] | |||
[[user:Peter Lin ]] | |||
Hi Mario, | Hi Mario, | ||
| Line 122: | Line 120: | ||
Felix | Felix | ||
:~ [[user:Fmark]] | |||
[[user:Fmark ]] | |||
| Line 184: | Line 181: | ||
Sum:=A+B;Divider:=2;FuncResult:=Sum/Divider; | Sum:=A+B;Divider:=2;FuncResult:=Sum/Divider; | ||
Example 2 (same calculation, shortened to one line):FuncResult:=(A+B)/2; | Example 2 (same calculation, shortened to one line):FuncResult:=(A+B)/2; | ||
Revision as of 19:14, 6 February 2016
Previous Product ID 28001-44
Popular Bioblast page
DatLab has been accessed more than
- 20,000 times (2016-01-27)
- 10,000 times (2015-01-10)
- 5,000 times (2013-10-30)
DatLab installation support

MitoPedia O2k and high-resolution respirometry:
O2k-Open Support
Question: DatLab was installed successfully but when trying to run it I get errors complaining about access to some strange looking files.
Alternative question: When installing DatLab [in this users specific university], it is obligatory to install, and use the O2k, as a PC administrator. Doing this precludes possibility of authorized O2k users operating O2k logged in as guest user (non-administrative account). Is there a workaround to this?
Answer:
There are two possible reasons for the described problems:
- The default directory to install DatLab is the "root" directory C:/. Depending on your institutions polices ordinary users may (standard procedure) or may not have write access to this high level directory. So the first fix is to try to install DatLab in a directory in which all users have write access. You can test this by generating and editing a simple text file in this directory.
- It may be that the installation of ALL programs is restricted to administrators by the settings in your institution. Obviously the program has to be installed by an administrator in this case. However, if the administrator installs the program into a directory in which ordinary / guest users have write access, these users will be able to use DatLab without any problems.
Note: The following set up does NOT work: The user has READ but not WRITE access to the directory DatLab is installed and wants to save the resulting files in directory he has WRITE access to. Reason: DatLab needs write access in the directory it is installed to to save configurations and temporary files. Solution: Install DatLab to a directory the user has full write access to.
DatLab 5 version history
DatLab 5.2
- Menu [O2k-Multisensor]/[Calibration] The Amp channel can now be calibrated using a multiple point linear regression:
- Select the Amp plot to be calibrated as active plot.
- Mark sections of the experiment for which the concentrations are known.
- Open the calibration window using either [O2k-MultiSensor]/[Calibration] or F5.
- In the left panel the current calibration is shown. The right panel is used to do a new calibration.
- Choose the desired unit for the calibrated signal from the drop down menu beside "Unit".
- Select the marks you want to use for the calibration by ticking the appropriate check boxes in the right panel under the heading „Select marks“. The averaged raw signal values, times, and slopes will be displayed for the selected marks.
- Leave the check boxes beside the slope column unchecked unless calibrating an Amplex Red experiment, see Amplex_red#Calibration_with_H2O2.
- Enter the known concentrations in the column labeled "Conc".
- DatLab will perform a linear regression after each field has been edited. The results, sensitivity and R2, are displayed below the calibration table. You can compare these parameters with those of the currently valid calibration in the left panel.
- Check the quality of the calibration with „Show Graph Plot“. The graph may be exported to the clipboard.
- Apply the new calibration values with „Calibrate“ or continue using the old calibration values with „Cancel“.
Manually entering parameters from a linear regression:
- Choose the desired unit for the calibrated signal from the drop down menu beside "Unit".
- Enter the desired values for sensitivity (slope of a regression signal against concentration) and intercept.
- Apply the Calibration values with „Calibrate“ or continue using the old calibration values with „Cancel“
- Menu [O2k-Multisensor]/[Calibration]: Functions effecting the calibrated signal have been separated from those effecting the slope calculated from the signal by placing the in different tabs: “Calibration” and “Slope”.
- Menu [Experiment]/[Edit]: It now possible to calculate the parameters describing Instrumental background oxygen flux directly in DatLab:
- Perform an instrumental background test and set marks on the O2 slope plot as usually.
- Open [Experiment]/[Edit].
- Click on the “Calculate” button beside the displayed current background correction parameters for the desired chamber.
- Select the marks that should be included in the calculation of background parameters by ticking their check boxes (in a standard background experiment usually all marks will be used).
- Background parameters will be calculated and displayed immediately.
- Control the quality of the regression with “Show graph”.
- As a further quality control you may select to view a graph with the background correction already applied to the slopes. The corrected slopes should be close to zero.
- The graph can be exported using the “Copy to Clipboard” function.
- Close the graph window to return to the linear regression window.
- Apply the background correction by clicking “Save” in the linear regression window and again save in the [Experiment]/[Edit] window.
- The parameters a and b are exported whenever the button "Calibrate and copy to clipboard" is used in the calibration window. Therefore the calibration list template (available at [1]) can be used for quality control and keeping a time track of background parameters.
DatLab 5.1.1.9
- Main menu: [Oxygraph] and [MultiSensor] were integrated into [O2k-MultiSensor]. [O2k-MultiSensor]/ [Calibration] (F5) will always open the Calibration Window for the active plot (O2, pX or Amp).
- pX: [O2k-MultiSensor]/ [Calibration] : Renaming the Amp channel, selecting units for the calibrated signal, setting a factor for the slope calculation, and calculating the slope from raw signal works now for the pX channel analogous to the Amp channel (see above).
- [O2k-MultiSensor]/ [Calibration]: When changing the selected unit for the calibrated signal, DatLab asks whether the calibration should be adjusted accordingly.
- Double clicking "Light on / Light off" in the O2k-Status line will switch on / off the chamber light.
DatLab 5.1.0.130
- Menu [MultiSensor]/ [MS Calibration] (Ctrl +F5): For the Amp channel, the user can now set the name of the plot (as it appears e.g. in axis labeling), the unit displayed in the calibrated plot, the multiplication factor used in slope calculation, and whether the slope should be calculated from the calibrated signal or the raw signal. To use these new features:
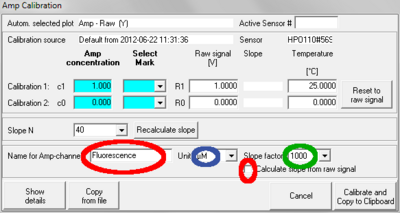
- Type the desired plot name in the field "Name for Amp-channel". Avoid long names.
- Choose the desired unit for the calibrated signal from the drop down menu beside "Unit". Default: "µM". Changing the unit will not (in DatLab 5.1.0.130) change the calibrated values. Therefore, to avoid confusion, the unit should be chosen before performing a calibration or upgrade to DatLab 5.1.1.7, see below.
- Choose the desired factor for slope calculation from the drop down menu beside "Slope factor". Default: 1000. The correct unit for the slope will be set by DatLab depending on the chosen unit for the calibrated signal and the factor for slope calculation. Changing the factor will recalculate the values for the slope plot correctly.
- To calculate the slope based on the raw signal, activate the checkbox "Calculate from raw signal". If viewing the raw (uncalibrated signal) it is recommended to use this option.
- Click "Calibrate and Copy to Clipboard" to apply all changes.
- Menu [Oxygraph]/ [Stirrer test] (F9) opens a window to enter the desired duration of a Stirrer test (Default: 30 s). After clicking "OK", stirring will be deactivated in both chambers and reactivated after the chosen time.
- Indicator for light in chambers: If the chamber light (not to be confused with light sources for fluorescence) is on, this is indicated in the status line by the text "Light on", highlighted in yellow. If the light is off the text reads "Light off", with no highlighting. This should be helpful when the chamber light is not obviously visible due to Fluorescence-Sensors inserted into the O2k front windows.
- Menu [Oxygraph]/[O2 Calibration] (F5): If the the values for R1 and R0 differ by less than 1 V a warning is displayed. This typically happens when either the same mark is chosen for R1 and R0 or when the two marks for R1 and R0 are set erroneously to the same "state" of the chamber, that is both regions are either for the "open chamber" or for the "closed chamber, no oxygen" state. Check the selected marks when seeing this warning. It is possible to ignore the warning and continue with "Calibrate and Copy to Clipboard".
- Menu [Oxygraph]/ [O2k Control] (F7) / [Configuration]: A field "pX Reference Electrode" was added. A serial number or other designation can be entered.
- Menu [Experiment]/ [View protocol] (Ctrl+F3): The information is now more clearly structured to discern between parameters used during a calibration (may originate from another file, different condition) and the parameters used when the file was recorded. Both, calibration information and the information about actually used parameters were expanded for the pX and Amp channels.

DatLab 5.1.0.20
- DatLab 5 supports connecting the oxygraph to a computer via the computers USB port and a standard USB cable (requires O2k-Core or O2k Series E and above). Additionally, DatLab 5 still supports connection to a computer via the RS232 port. Therefore, it is possible and highly recommended to upgrade all oxygraphs in a lab to DatLab 5. When connecting to the O2k for the first time, the type of connection (USB or RS232) is set by radio buttons. When connecting via the USB port any detected oxygraphs will be identified by their serial number and can be selected in the drop down menu to the right of "USB Port". When connecting via the RS232 port the proper serial port "Com..." can be selected in the drop down menu to the right of "Serial Port".
- DatLab 5 allows to open DatLab files by double clicking them in the Windows file manager or similar programs. First time use: Double click any DatLab file in the Windows file manager, select "open this file type always with this program", select "browse", then navigate to the file Datlab5.exe. Usually this file will be in C:\Datlab\DatLab5.exe. Depending on your Windows settings the extension '.exe' may not be displayed: In this case you can differentiate between DatLab5.exe and DatLab5.ini by right clicking and selecting "properties". The exact procedure will depend on the version and language of your Windows operating system. After doing this once, Windows will always use DatLab 5 to open DatLab files.
- Menu [Graph]/[Scaling] (F6): It is possible to set the maximum value for the Y axis of a plot. When changing one or two parameters (minimum, maximum, or range) the remaining parameters will be adjusted automatically after pressing "OK" or clicking in a different field. Fill out only the fields Minimum and Range to simulate the behavior of DatLab 4.
- Menu [Graph]/[Scaling] (F6):It is possible to selectively copy scaling settings to other windows by using the "Apply to Graph 1", Apply to Graph 2", etc buttons. These buttons replace the "Apply to all" button. This will be helpful in MultiSensor applications when e.g. two windows should show oxygen plots (with identical scaling) and two windows should show fluorescence plots (with identical scaling).
- The number of points used for slope calculations can now be changed for the pX and the Amp channels. Select [MultiSensor]/[MS Calibration]: Slope N: Select the number of data points (N = 40 to N = 5 in intervals of 5) used to calculate the slope. A high value of N yields a highly smoothed curve, whereas a low value of N improves time resolution.
- The slopes for the pX and Amp channel are now calculated with the correct sign for the first order time derivative. That is, if the calibrated signal decreases the slope will have a negative sign, if it increases the sign of the corresponding slope will be positive. The slope for the O2 channels is still calculated to give a positive sign for a decreasing signal, signifying a "positive " respiration.
- Proton production rates can be calculated on line. In the menu select [Plots]/[Proton Flux], see O2k-pH ISE-Module.
- The amperometric channel that, due to its main use for "NO electrodes", was labeled "NO" in DatLab 4 was renamed to "Amp" to reflect its versatile nature. It is used e.g. to record the data from the O2k-Fluorescence LED2-Module.
- Faster processing of DatLab Data (this required a larger minimum file size).

DatLab for Apple
Hi Mario, By the way, do you have any version of DataLab that can be installed in Apple Mac system? Or, do anyone from your company know how it get it works?
Hi Peter,
We develop DatLab only for Windows, because its the platform all our customers can live with and most customers have to live with. We are aware that it is not the best platform for scientific software (this might be Linux > Apple > Windows), but unfortunately we do not have a choice here. Even the ongoing software developing for one platform is a very major and cost intensive project for a company of our size, therefore we can not do this for multiple platforms. However, there were rumors that DatLab runs on a Windows emulator software for Apple. This was before we hat this wiki for collection of this kind of user feedback :-( . We do not have experiences in this on our own. I have only experience with running DatLab under a Windows emulator for Linux. This works always for "off line " data analysis and for some DatLab versions even for on-line data accumulation. Without being any sort of Apple expert, I would guess things might be similar for Apple based windows emulators.
Any experiences from customers in this regard would be highly welcome of this page
best greetings Mario --Fasching Mario 09:13, 22 February 2012 (CET)
Hi Mario, By the way, to open DatLab file in Mac system, I install a program called "VitualBox" which is free for basic version. With that, I can install windows in my Mac and therefore all other programs that can be installed in PC. I can open DatLab file without any problem. I am not sure if I can run DatLab to collect data in real-time. Never try it yet since I use other PC to run experiment.
Hi Mario,
we have used an Apple MacBook running DatLab 4 under Parallels 7 for both collecting and analysing data on expedition. It works all right, not superbly, as there are some issues with the right click and a couple of shortcuts. Once you get used to this, you can do everything in DatLab that you can do on a PC. Best wishes
Felix
DatLab response is slow
- Problem: The DatLab software is extremely slow. Opening an experiment can take up to several minutes (usually around 1-2 min) and the same goes for any kind of operation undertaken in the software once the experiment is open (changing axis scale, shifting time frame etc.)
- Solutions: A frequent problem encountered is that DatLab files are saved remotely (on a server) without the user realizing that this is the case. Files that are just being acquired (during the measurement) should always be saved locally. OFF line line files can usually be processed remotely but this depends on the the network speed. To see if the problem is caused by remote files, make sure to save a DatLab file locally on your computer ("C drive") and determine if this does improve performance. For working with DatLab in off-line mode (processing stored files) working via a Network is usually possible, but depending on Network speed and size of file it may sometimes be advisable to copy large files to a local drive (e.g. when working via a WLAN connection).
- There may be an inadvertently small setting for the data sampling interval in DatLab (default 2 s). Very small data sampling intervals are usually necessary only for kinetics experiments. Such very small data sampling intervals may lead to a slow responding DatLab, especially for long recordings. Check the 'Experiment' / 'Edit' window to see the settings for an already recorded file or set the data sampling interval for new files in the 'Oxygraph' / 'O2k Control' window
Export data from DatLab
Export data from DatLab may refer to
- exporting time averaged values for certain regions of the experiment: [Marks] / [Statistics]
- exporting parts of or an entire plot in a point per point fashion to an text file for advanced analysis or drawing the plot outside DatLab: [File]/[Export]/[Data to text File]
- exporting events [File]/[Export]/[Events to text File]
See C MiPNet12.07 DatLab Guide for descriptions of all three functions.
Problems with exporting plots to a text (.csv) file
- Export data does not work for DatLab versions below 4.2.1
- Make sure that DatLab and the Spreadsheet program use the same decimal separator. DatLab takes the character for the decimal separator form the windows system settings.
- It seems that with some recent versions of Excel importing a comma separated text file involves playing around with settings. Solutions:
- (Excel) Set the separator character in the DatLab export function function to the one expected by Excel (may not be possible if Excel expects e.g. a blank).
- (Excel) Change the WINDOWS (not Excel!) settings (Regions and languages / more options) so that the "list separator" character is the same as used by the DatLab export function. See also this link to Microsoft.
- Libre(Open)Office still shows the behavior known from previous Excel versions: double clicking a file opens a preview window and the separator can be chosen interactively.
DatLab scripting function
We do not expect many users to generate scripts on their own (same as with with Graph layouts, TIP setups, etc). But we can generate new scripts without modifying the program itself and make them available to customers e.g. via the Import templates function (or by just copying the file). The functions described here are only available for DatLab 5.1.1.101 and above. The functions may also be removed for released versions of DatLab with a higher version number.
Help
The scripting function to generate new plots is started with [Ctrl+Alt+D], this will open the "calculated columns" window.
A new script is generated by clicking "Generate Plot"
The generation of the scripts themselves is explained in the "help function" of the script window, where also an example script can be found.
A script may be tested e.g. by clicking "compile".
Once a script is finished there are two save buttons:
"Save Macro" (right upper corner) will save the new script to a separate file in the DatLab user directory (in \DatLab\APPDATA\CALC), so it can be reused (and modified) later for other files just like a graph layout, TIP setup et all. In this way a script can also be shared with other users or incorporated to the default functions available for all users.
"Generate plot" or "Update plot" (lower right corner) will save the script to the active DatLab file, that is a new plot is generated. After saving in this way, the new plot can be used: In the Main Menu select [Graph]/[Select Plots]. New plots will be listed at the end of the list. Select the new plots for the desired windows as usual. This script used to generate a new plot is also saved with the particular DatLab file. So if the same DatLab file is opened later, the plot (and its script) will be available, and it is not necessary to load the script form the user directory again.
Help in DatLab
- This text needs to be edited!
Define Plot-Variables by clicking the unit in the list with the right mouse button.
The result of the calculation has to be assigned to the variable "FuncResult". To define additional variables (for easier reading of the script) by the keyword "var" and a type definition ("float"). Each line has to have a trailing semicolon. Example 1 (a little bit oversized to show variable use): var Sum: Float;var Divider: Integer; Sum:=A+B;Divider:=2;FuncResult:=Sum/Divider; Example 2 (same calculation, shortened to one line):FuncResult:=(A+B)/2;